Designing the tool that turned 40 years of environmental data into autonomous analyses
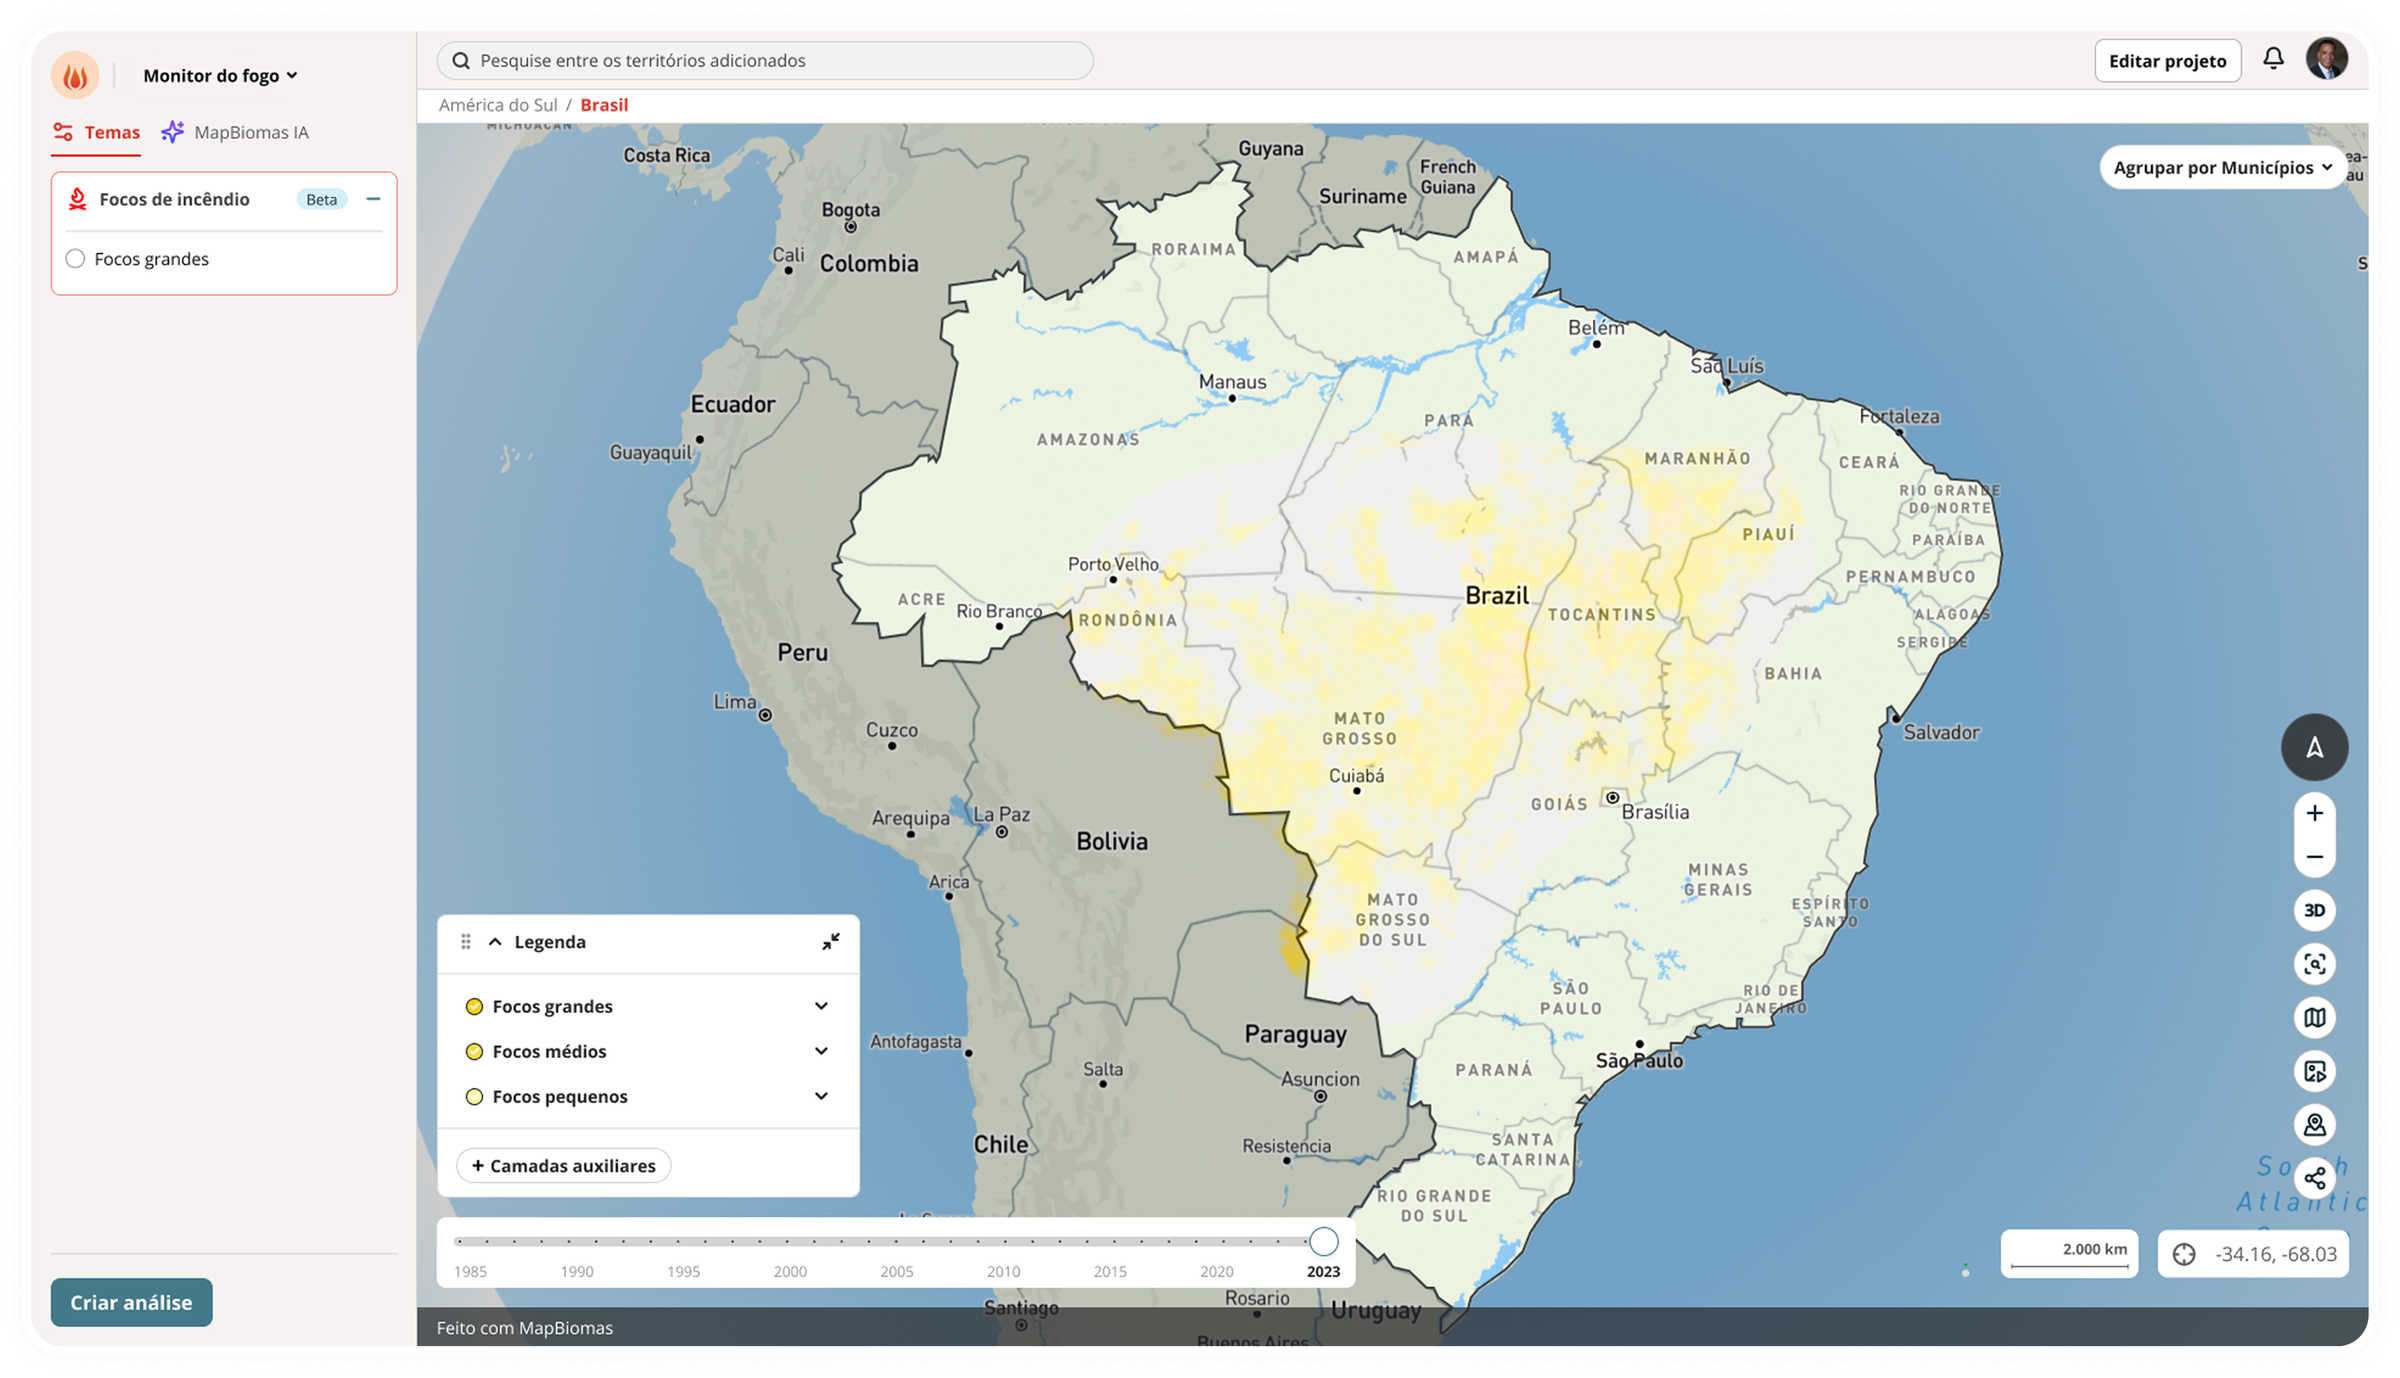
MapBiomas is a leading initiative in land use and land cover mapping in Brazil. Meu MapBiomas is the product that gives organizations the autonomy to build their own analyses from this data, setting up dashboards with custom branding, territories of interest, and data layers to monitor. This unlocked a demand that led Meu MapBiomas to hit its annual adoption goal in five days.
My role
Product Designer
Scope
End-to-end, from discovery to delivery
Team
Product Managers, developers, geoprocessing and environmental monitoring specialists
The problem
Although MapBiomas makes its data publicly available, using that data within an organization's specific context depended on a geoprocessing specialist, who handled the territorial clipping, cross-referenced indicators, and produced custom analyses. As the platform grew, the backlog of requests revealed a pent-up demand from organizations increasingly seeking analyses tailored to their own contexts. Addressing this was a major opportunity to scale MapBiomas' impact.
The solution
Meu MapBiomas was created in this context, with the goal of giving organizations the autonomy to combine MapBiomas' public data with their own datasets to build territorial analyses without relying on a geoprocessing specialist. More than just browsing maps, the product enables each organization to build its own analysis around a real-world problem.
The impact
The annual goal of 100 registered organizations on Meu MapBiomas was reached in just five days after launch. The platform is now adopted by Brazil's leading environmental organizations, including SOS Mata Atlântica, the Ministry of Environment, IPAM, and OTCA.
Three key insights
01. Fewer decisions per screen, more clarity for a non-technical audience 02. Real-time feedback that builds credibility at every step 03. A scope constraint that led to a simpler interface to use and maintain
Insight 01
Fewer decisions per screen, more clarity for a non-technical audience
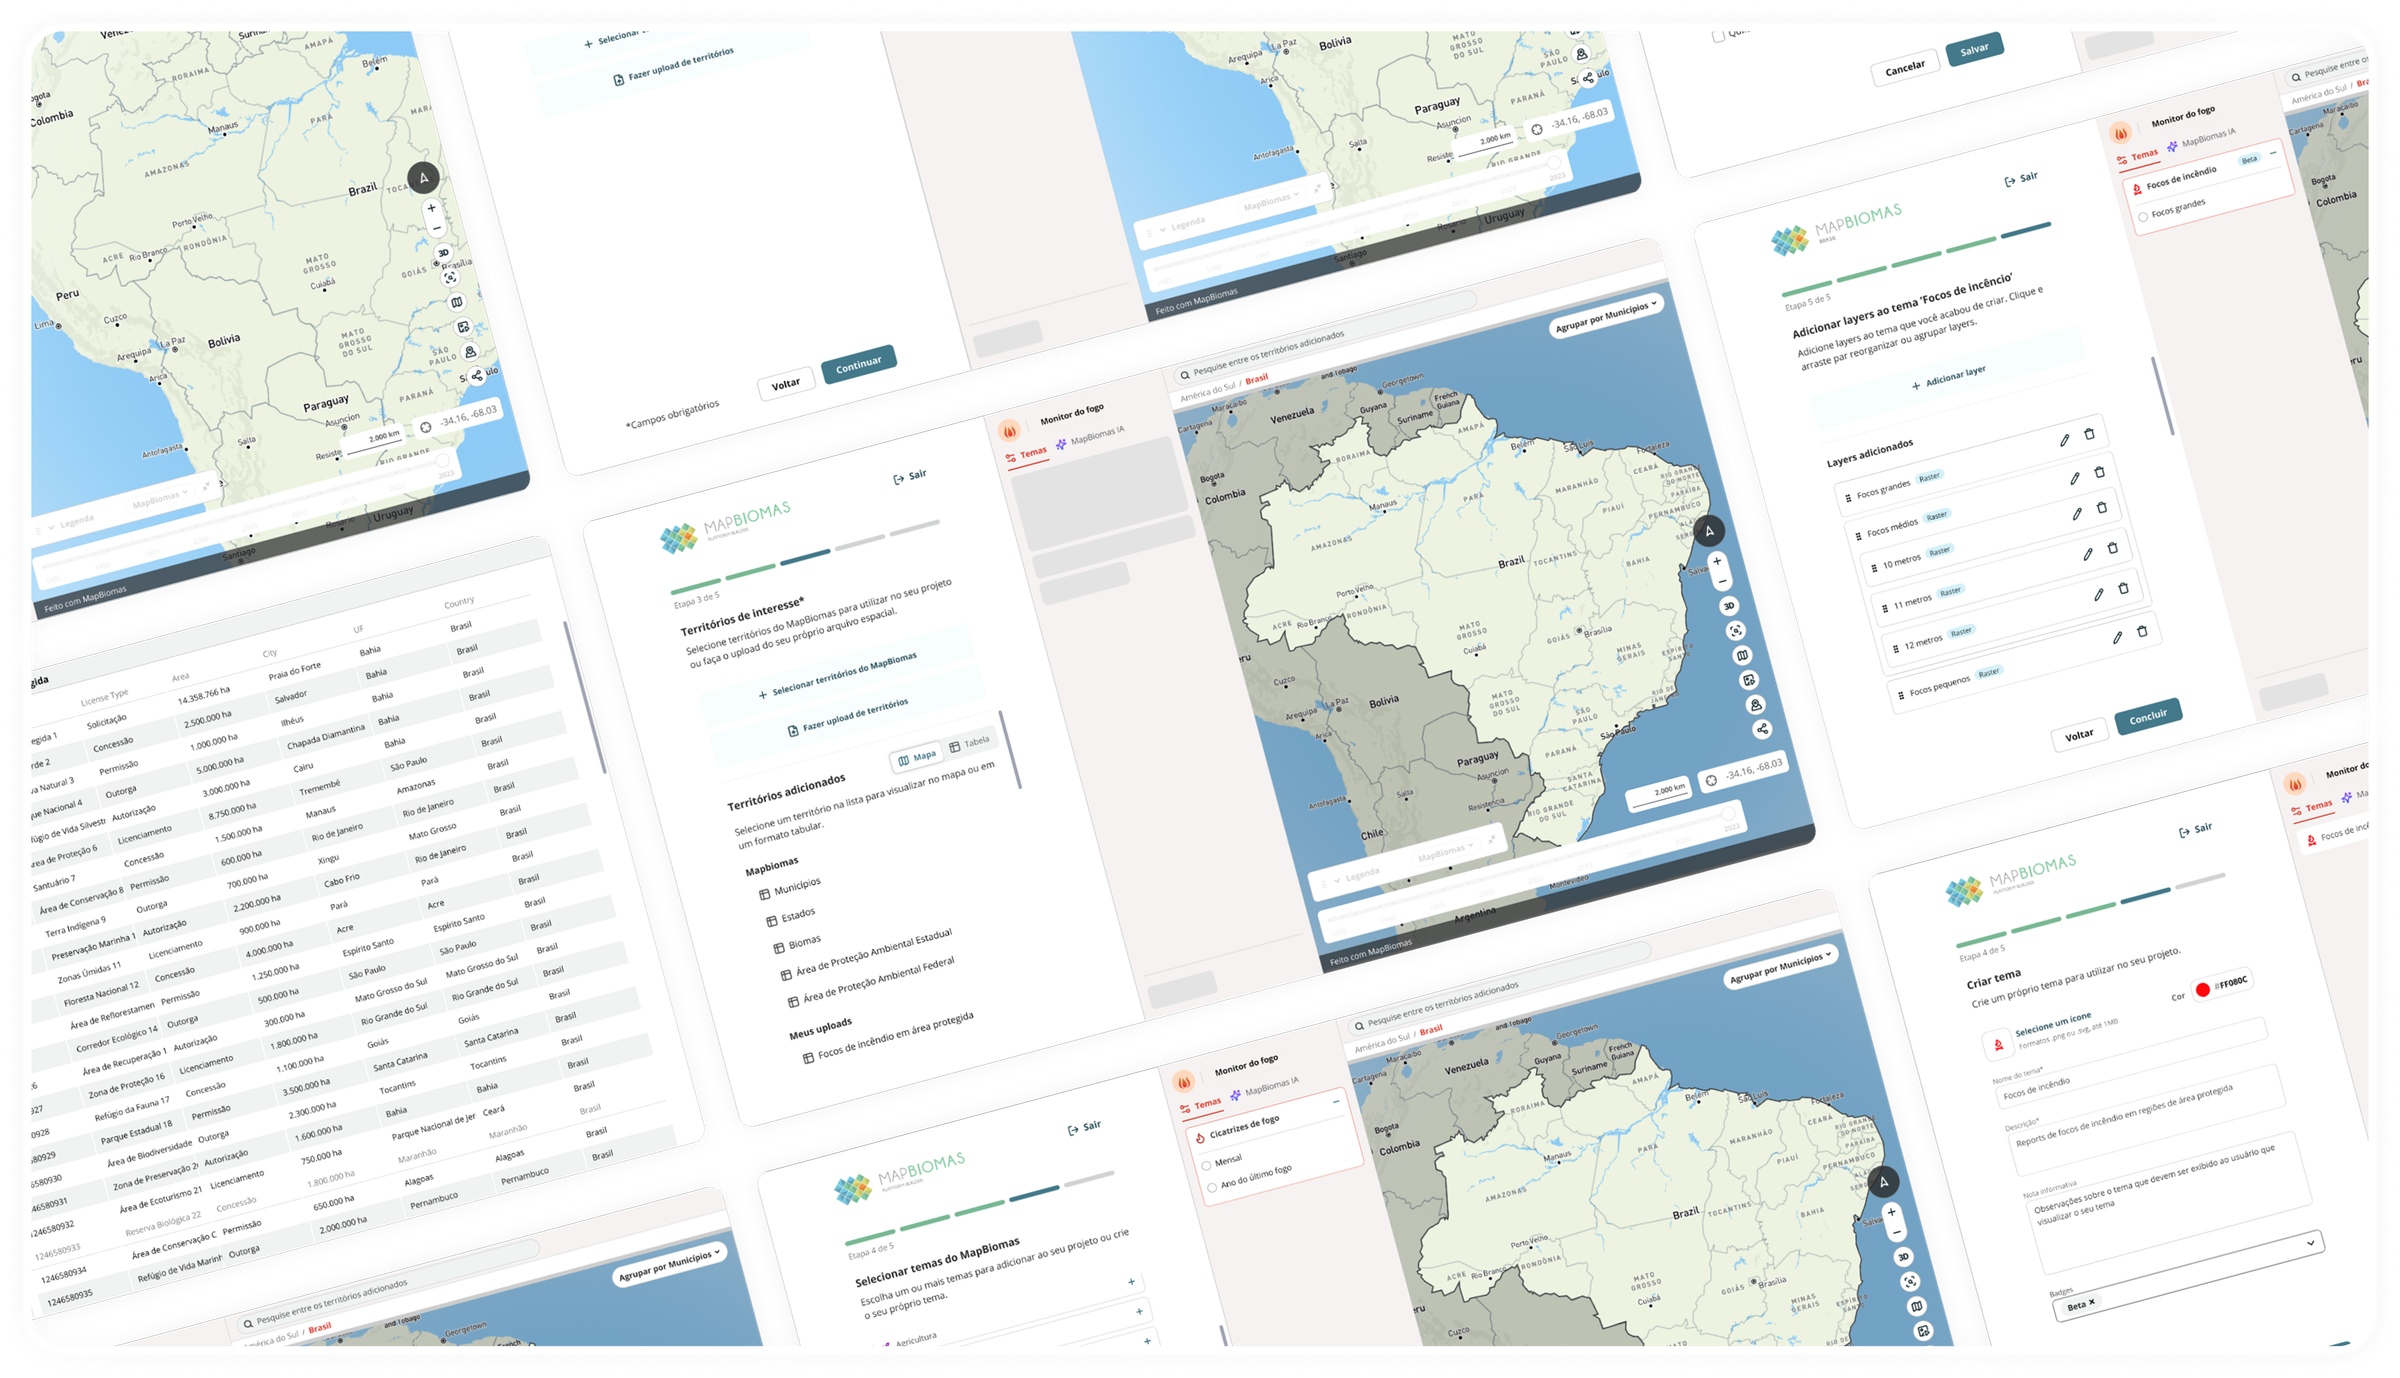
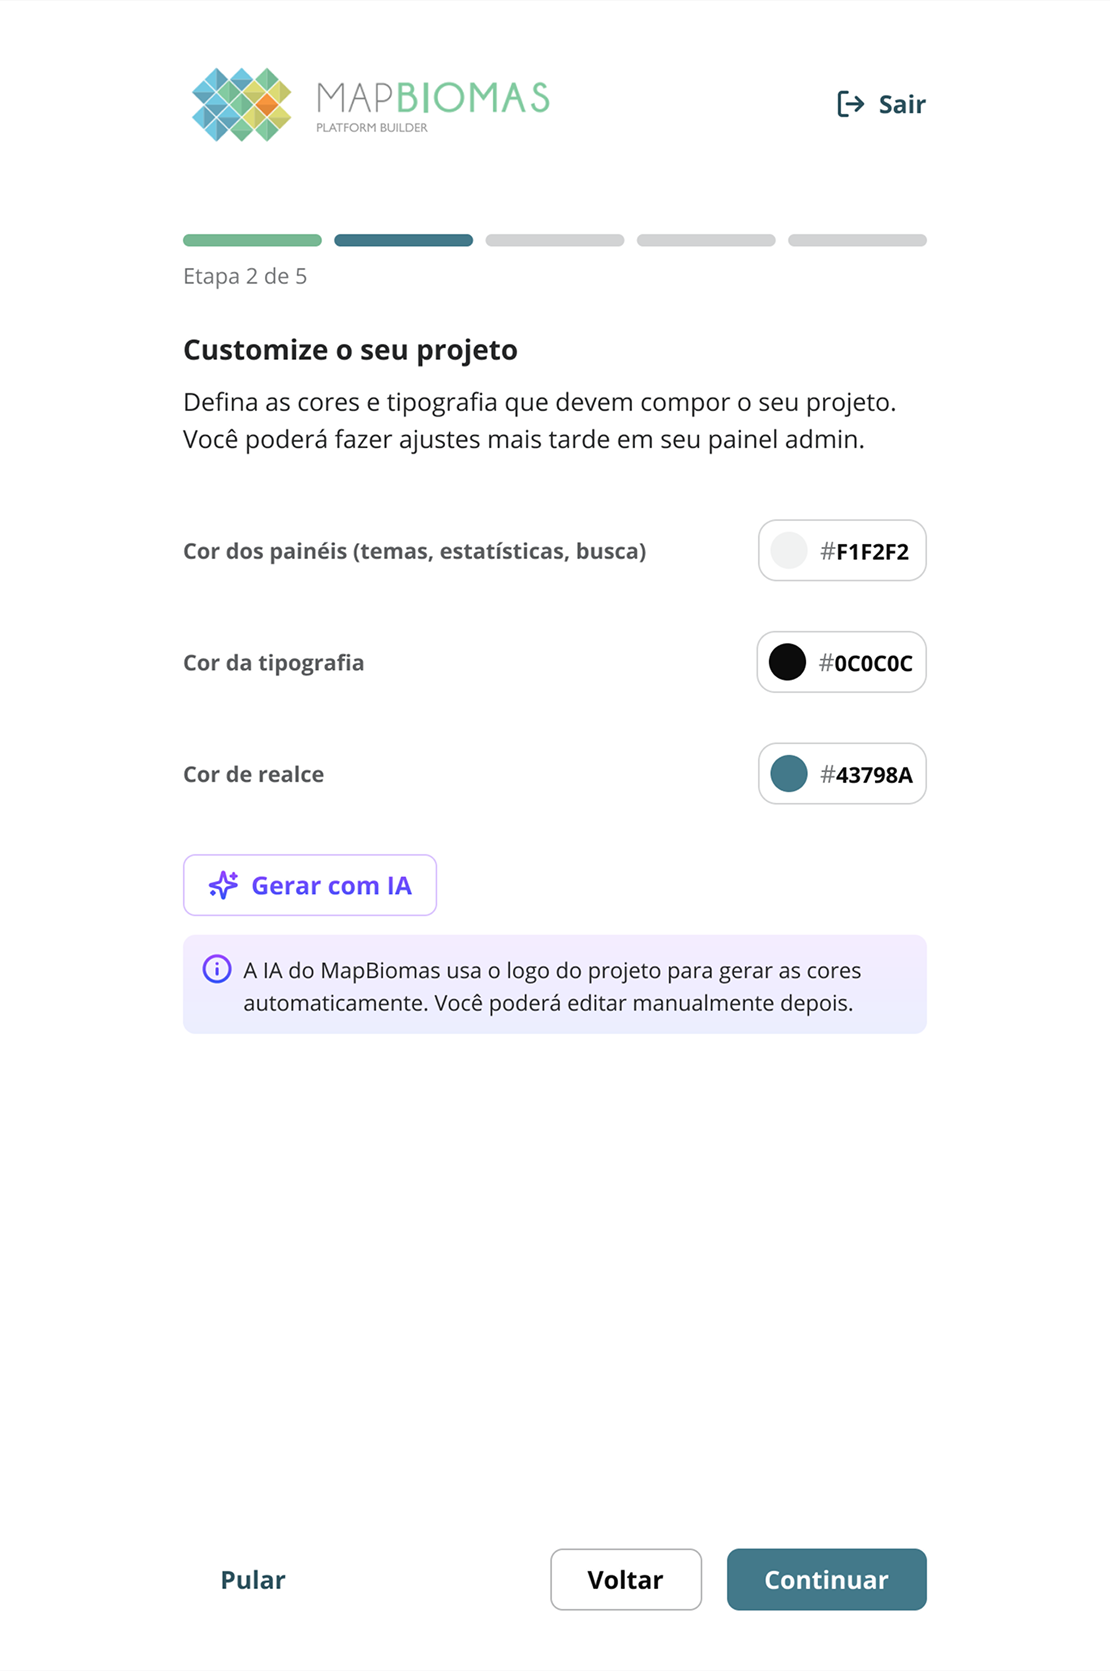
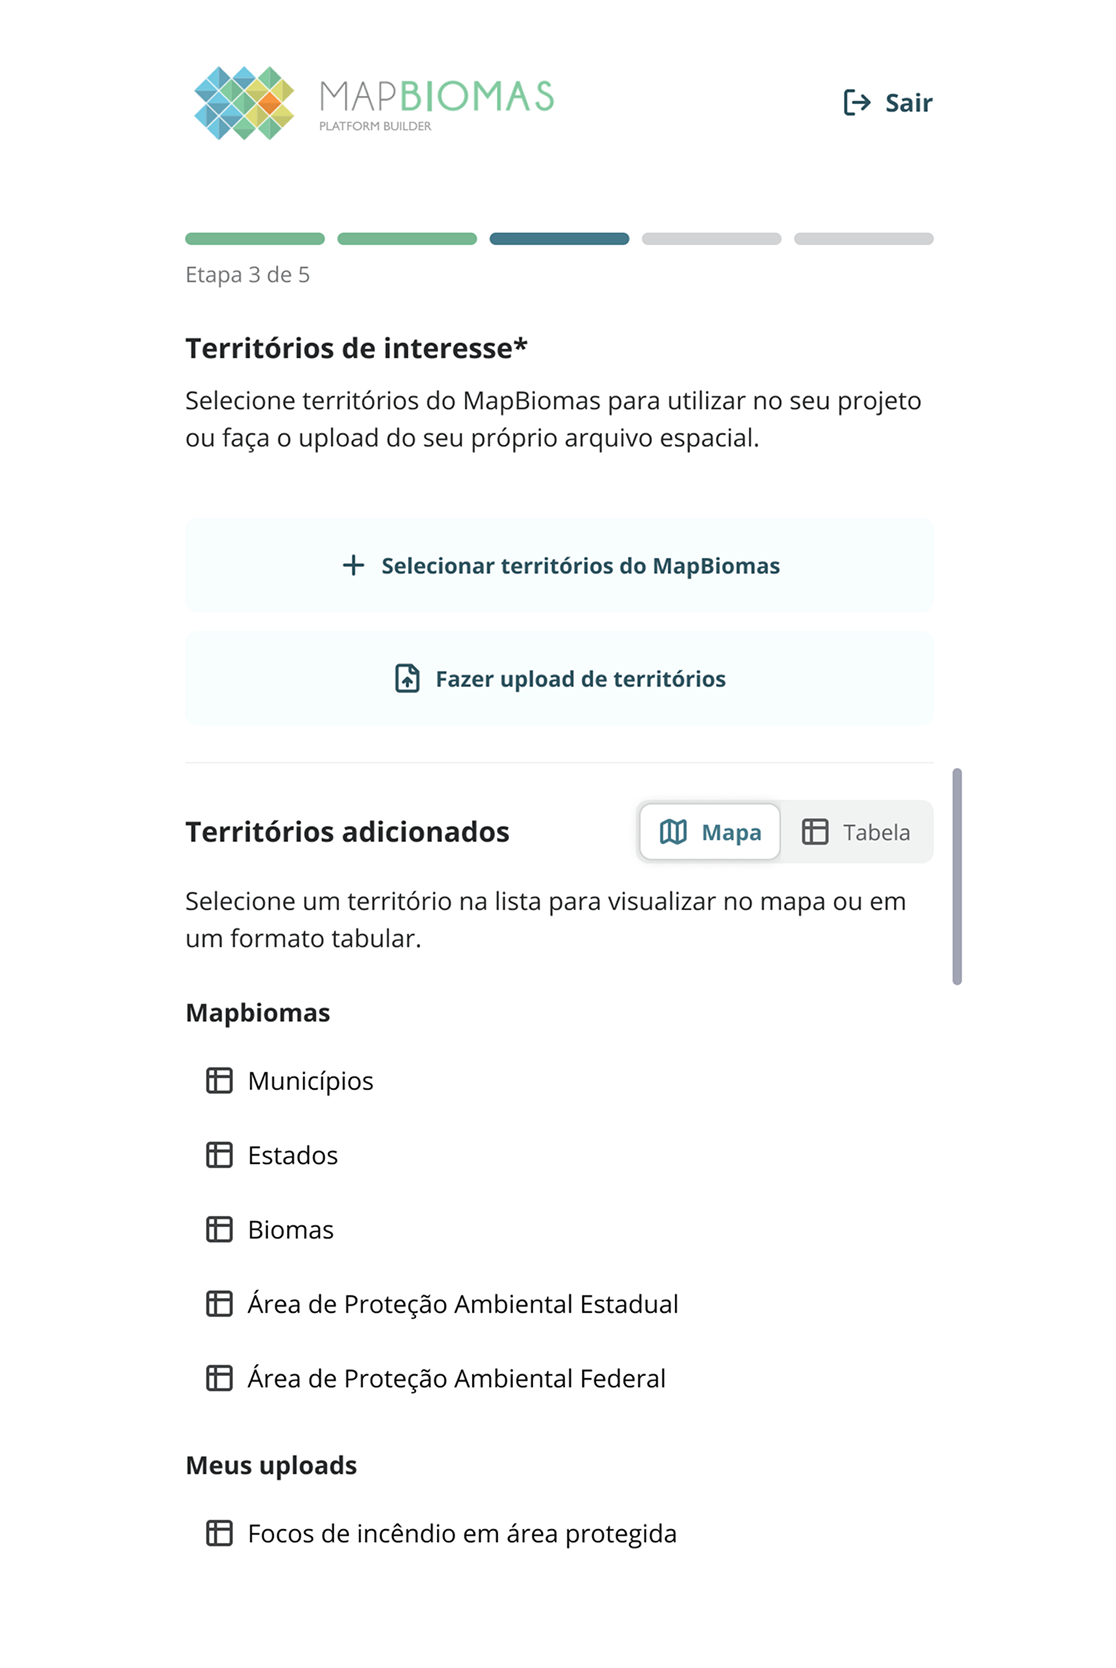
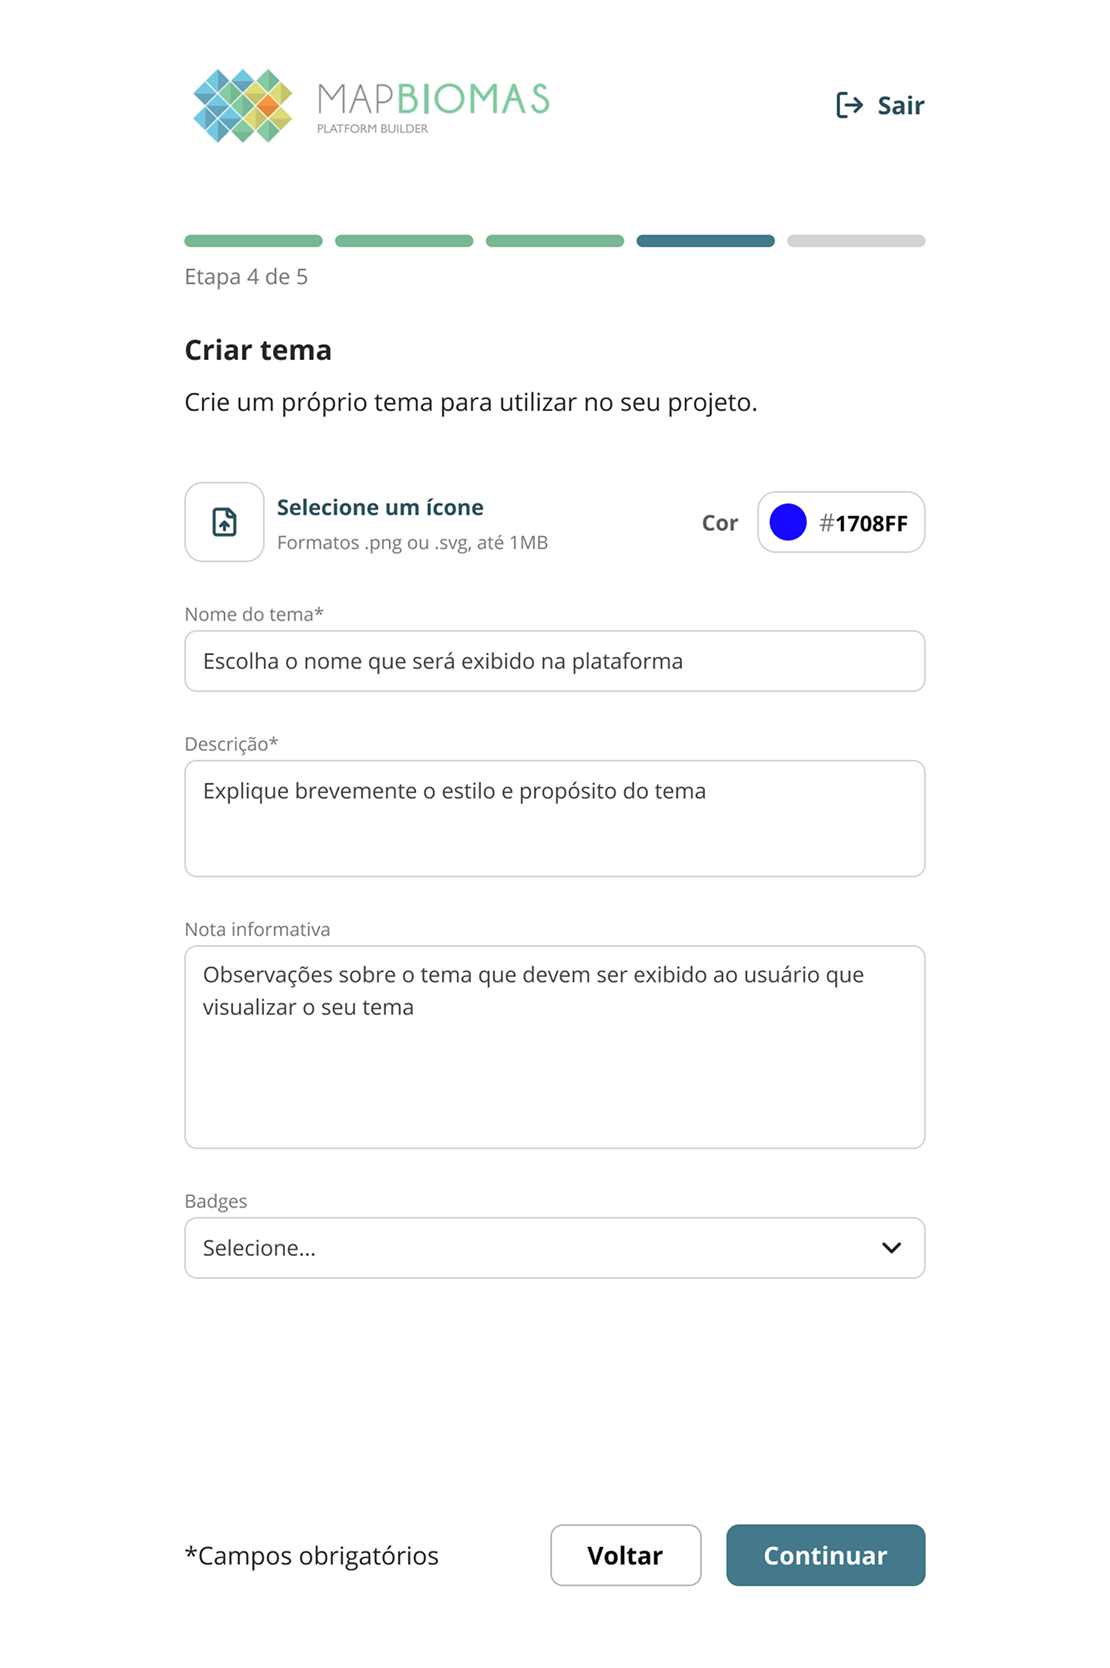
The onboarding was designed to reduce the cognitive load of a flow that requires multiple decisions: branding setup, territory selection, data layers, and legend configuration. By designing a progressive form with one decision per step, optional steps, and free navigation to go back, users can stay focused on the current task while the complexity behind the dashboard setup stays hidden from the platform's target audience of non-technical users.
Insight 02
Real-time feedback that builds credibility at every step
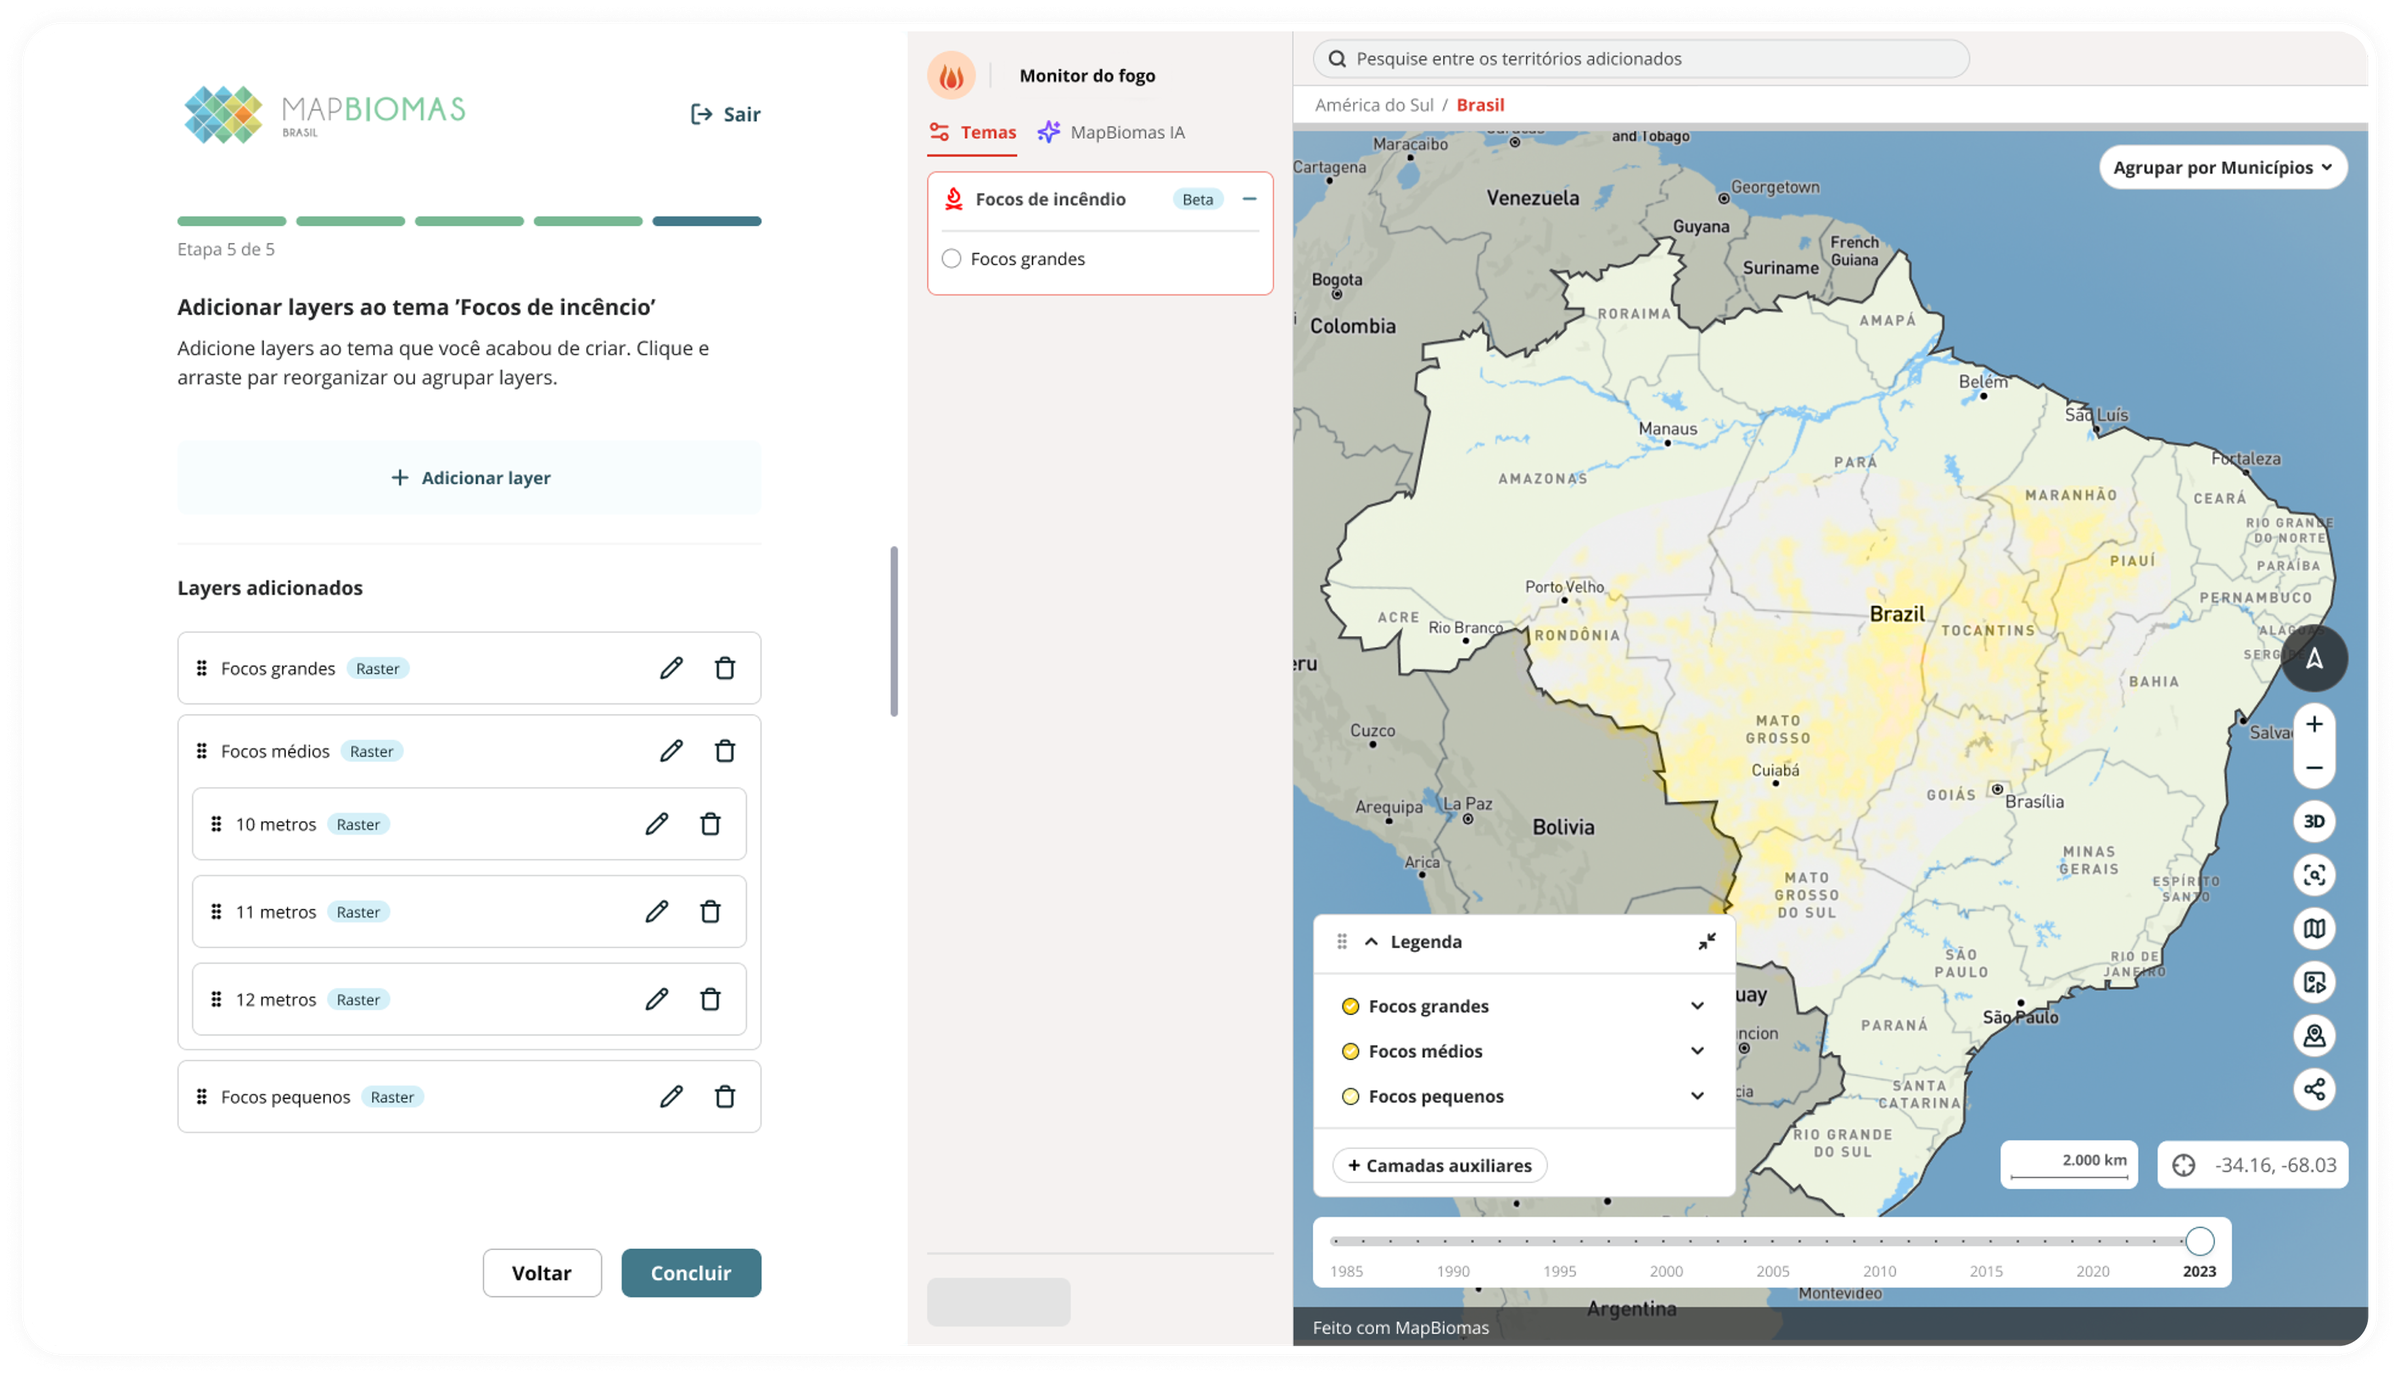
As the user configures the dashboard, the platform renders a real-time preview using actual MapBiomas data. Every choice of territory, data layer, or time period is immediately reflected on screen, providing visibility into what's being built and confidence in data quality before finalizing. To sustain this without impacting performance, we pre-processed the geoprocessing data from Google Earth Engine.
Insight 03
A scope constraint that led to a simpler interface to use and maintain
With three months to go from zero to production, building separate flows for creating a new dashboard and editing an existing one wasn't feasible. The short-term solution was to design a single interface that serves both moments. In the end, what started as a way to meet a tight deadline proved strong enough to be adopted as the permanent solution, simplifying maintenance and giving users a single mental model for creating and editing.
Results
- Organizations started creating their own analyses without relying on MapBiomas' technical team. Onçafari publicly described this gain after using the platform autonomously.
- Autonomy led to concrete environmental decisions. Onçafari cross-referenced monitoring data with land use history and identified 60,000 hectares converted to soy within a monitored jaguar's home range.
- The annual goal of 100 organizations was reached in five days. One month after launch, over 200 organizations had requested access, double the target for the entire year.